|
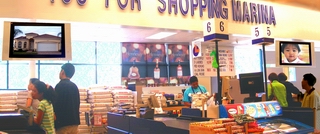
Scrolling Lightbox
High Impact Advertising
Numerous Hot Bay Area Markets To Choose From
|
Location Profile:
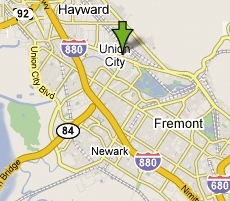
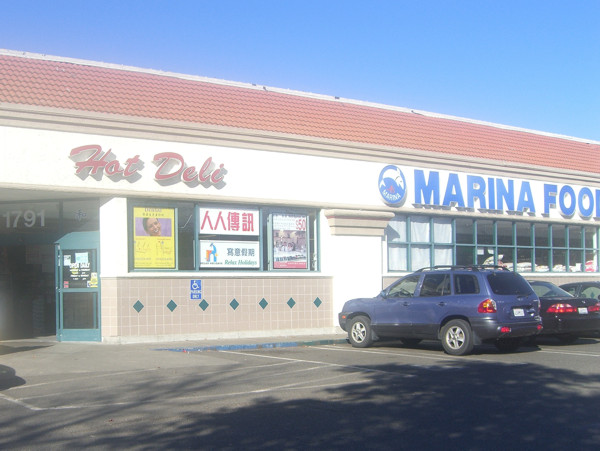
Marina Food is located in the Union City central business district across from City Hall.
It is the anchor store in a mostly Asian shopping center that includes May Flower Restaurant,
Mongolian Hotpot, China Tofu, Shengkee Bakery, Little Potato, Banyan Tree Malaysian restaurant
Cathay Bank, Tapioca Express and 20 other businesses . Marina Food attracts visitors of many
demographics including lunch crowds from the government agencies, as well as routine Chinese,
Japanese, Filipino and Korean patrons.
|
|
|
Scrolling Lightboxes
|
Top |
|
Display Size/Type:
|
Scrolling Lightbox
|
|
|
Display Frequency:
|
8,300 views/month per lightbox
(each ad displays for 17 seconds every 2 minutes from 9am to 10pm)
|
|
|
Shopper Traffic Count:
|
27,000/month; 324,000/year
|
|
|
Viewership:
|
100,000 Gross Impressions/year
|
|
|
Viewable Locations:
|
Viewable at parking lot and store entrance
|
|
|
Gross CPM:
|
Rate card available upon request
|
|
|
* Additional combo rates
available: Multiple locations; Less than annual contract. Call for quote.
|
|
|
|
Note: Maximize impact by ordering one ad spot at each of the lightboxes. Every shopper will remember your ad message.
|
|
| |
|
Big Screen TVs
|
Top |
|
Display Size/Type:
|
Two 32" Big Screen TVs
|
|
|
Display Frequency:
|
4,680 views/month per lightbox
(each ad displays for 15 seconds every 10 minutes from 9am to 10pm)
|
|
|
Shopper Traffic Count:
|
16,500/month; 198,000/year
|
|
|
Viewership:
|
56,100 Gross Impressions/year
|
|
|
Viewable Locations:
|
Viewable at checkout
|
|
|
Gross CPM:
|
6.00/year per lightbox
|
|
| |
|
Lightbox Display Rates: Annual Basis
|
2 Displays
|
|
Monthly Cost
|
Call for quote *
|
|
Production Cost
|
Existing video or simple text - FREE; see right column
|
|
|
|
* Additional combo rates
available: Multiple locations; Less than annual contract. Call for quote.
|
|
| |
|
Display Opening Date:
|
opened May 2006
|
|
|
Actual Picture:
|
|
|
Actual Scrolling:
|
Top
|
| |
 Census Demographics
(Click to view)
Census Demographics
(Click to view)
Demographic Characteristics
| RACE |
| Total population |
66,457 |
100.0% |
65,850 |
100.0% |
281,421,906 |
100.0% |
| White |
19,918 |
30.0% |
19,635 |
29.8% |
211,460,626 |
75.1% |
| Black or African American |
4,456 |
6.7% |
4,409 |
6.7% |
34,658,190 |
12.3% |
| American Indian and
Alaska Native |
353 |
0.5% |
337 |
0.5% |
2,475,956 |
0.9% |
| Asian |
29,098 |
43.8% |
28,837 |
43.8% |
10,242,998 |
3.6% |
| Hawaiian & Other Pac. Islander |
609 |
0.9% |
605 |
0.9% |
398,835 |
0.1% |
| Hispanic or Latino (of any race) |
15,740 |
23.7% |
15,772 |
24.0% |
35,305,818 |
12.5% |
|
| SEX AND AGE |
| Total Population |
66,457 |
100.0% |
65,850 |
100.0% |
281,421,906 |
100.0% |
| Male |
33,041 |
49.7% |
32,698 |
49.7% |
138,053,563 |
49.1% |
| Female |
33,416 |
50.3% |
33,152 |
50.3% |
143,368,343 |
50.9% |
| Under 5 years |
4,859 |
7.3% |
4,804 |
7.3% |
19,175,798 |
6.8% |
| 5 to 9 years |
5,385 |
8.1% |
5,330 |
8.1% |
20,549,505 |
7.3% |
| 10 to 14 years |
5,134 |
7.7% |
5,082 |
7.7% |
20,528,072 |
7.3% |
| 15 to 19 years |
5,049 |
7.6% |
5,029 |
7.6% |
20,219,890 |
7.2% |
| 20 to 24 years |
4,577 |
6.9% |
4,527 |
6.9% |
18,964,001 |
6.7% |
| 25 to 34 years |
10,635 |
16.0% |
10,476 |
15.9% |
39,891,724 |
14.2% |
| 35 to 44 years |
11,174 |
16.8% |
11,007 |
16.7% |
45,148,527 |
16.0% |
| 45 to 54 years |
9,134 |
13.7% |
9,097 |
13.8% |
37,677,952 |
13.4% |
| 55 to 59 years |
2,901 |
4.4% |
2,901 |
4.4% |
13,469,237 |
4.8% |
| 60 to 64 years |
2,238 |
3.4% |
2,238 |
3.4% |
10,805,447 |
3.8% |
| 65 to 74 years |
3,062 |
4.6% |
3,049 |
4.6% |
18,390,986 |
6.5% |
| 75 to 84 years |
1,745 |
2.6% |
1,745 |
2.6% |
12,361,180 |
4.4% |
| 85 years and over |
564 |
0.8% |
565 |
0.9% |
4,239,587 |
1.5% |
| Median age (years) |
32.8 |
|
32.8 |
|
35.3 |
|
|
| RELATIONSHIP |
| Total population |
66,457 |
100.0% |
65,850 |
100.0% |
281,421,906 |
100.0% |
| In households |
66,120 |
99.5% |
65,508 |
99.5% |
273,643,273 |
97.2% |
| Householder |
18,540 |
27.9% |
18,270 |
27.7% |
105,480,101 |
37.5% |
| Spouse |
12,389 |
18.6% |
12,232 |
18.6% |
54,493,232 |
19.4% |
| Child |
22,861 |
34.4% |
22,674 |
34.4% |
83,393,392 |
29.6% |
| Own child under 18 years |
15,643 |
23.5% |
15,429 |
23.4% |
64,494,637 |
22.9% |
|
| HOUSEHOLDS BY TYPE |
| Total households |
18,540 |
100.0% |
18,270 |
100.0% |
105,480,101 |
100.0% |
| Family households (families) |
15,631 |
84.3% |
15,438 |
84.5% |
71,787,347 |
68.1% |
| With own children under 18 years |
8,445 |
45.6% |
8,303 |
45.4% |
34,588,368 |
32.8% |
| Married-couple family |
12,389 |
66.8% |
12,232 |
67.0% |
54,493,232 |
51.7% |
| With own children under 18 years |
6,947 |
37.5% |
6,837 |
37.4% |
24,835,505 |
23.5% |
| Female householder, no husband present |
2,238 |
12.1% |
2,217 |
12.1% |
12,900,103 |
12.2% |
| With own children under 18 years |
1,106 |
6.0% |
1,082 |
5.9% |
7,561,874 |
7.2% |
| Householder living alone |
705 |
3.8% |
700 |
3.8% |
9,722,857 |
9.2% |
| Average household size |
3.57 |
|
3.59 |
|
2.59 |
|
| Average family size |
3.83 |
|
3.85 |
|
3.14 |
|
|
| HOUSING OCCUPANCY |
| Total housing units |
18,795 |
100.0% |
18,504 |
100.0% |
115,904,641 |
100.0% |
| Occupied housing units |
18,540 |
98.6% |
18,270 |
98.7% |
105,480,101 |
91.0% |
| Vacant housing units |
255 |
1.4% |
234 |
1.3% |
10,424,540 |
9.0% |
| Homeowner vacancy rate (percent) |
0.00 |
|
0.00 |
|
2.00 |
|
| Rental vacancy rate (percent) |
1.00 |
|
1.00 |
|
6.00 |
|
|
| HOUSING TENURE |
| Occupied housing units |
18,540 |
100.0% |
18,270 |
100.0% |
105,480,101 |
100.0% |
| Owner-occupied housing units |
13,212 |
71.3% |
13,148 |
72.0% |
69,815,753 |
66.2% |
| Renter-occupied housing units |
5,328 |
28.7% |
5,122 |
28.0% |
35,664,348 |
33.8% |
|
|
| Social Characteristics |
| EDUCATIONAL ATTAINMENT |
| Population 25 years and over |
41,826 |
100.0% |
41,463 |
100.0% |
182,211,639 |
100.0% |
| Less than 9th grade |
4,173 |
10.0% |
4,141 |
10.0% |
13,755,477 |
7.5% |
| 9th to 12th grade, no diploma |
3,972 |
9.5% |
3,989 |
9.6% |
21,960,148 |
12.1% |
| Highschool grad incl. equivalency |
8,754 |
20.9% |
8,736 |
21.1% |
52,168,981 |
28.6% |
| Some college, no degree |
8,886 |
21.2% |
8,879 |
21.4% |
38,351,595 |
21.0% |
| Associate degree |
3,479 |
8.3% |
3,474 |
8.4% |
11,512,833 |
6.3% |
| Bachelor's degree |
8,941 |
21.4% |
8,786 |
21.2% |
28,317,792 |
15.5% |
| Graduate or professional degree |
3,621 |
8.7% |
3,458 |
8.3% |
16,144,813 |
8.9% |
|
| MARITAL STATUS |
| Population 15 years and over |
50,870 |
100.0% |
50,371 |
100.0% |
221,148,671 |
100.0% |
| Never married |
14,779 |
29.1% |
14,586 |
29.0% |
59,913,370 |
27.1% |
| Now married, except separated |
29,699 |
58.4% |
29,451 |
58.5% |
120,231,273 |
54.4% |
| Separated |
790 |
1.6% |
790 |
1.6% |
4,769,220 |
2.2% |
| Widowed |
2,261 |
4.4% |
2,284 |
4.5% |
14,674,500 |
6.6% |
| Divorced |
3,341 |
6.6% |
3,260 |
6.5% |
21,560,308 |
9.7% |
|
| LANGUAGE SPOKEN AT HOME |
| Population 5 years and over |
61,561 |
100.0% |
60,905 |
100.0% |
262,375,152 |
100.0% |
| English only |
24,827 |
40.3% |
24,538 |
40.3% |
215,423,557 |
82.1% |
| Spanish |
10,214 |
16.6% |
10,207 |
16.8% |
28,101,052 |
10.7% |
| Other Indo-European languages |
6,842 |
11.1% |
6,564 |
10.8% |
10,017,989 |
3.8% |
| Asian and Pac. Island languages |
19,209 |
31.2% |
19,127 |
31.4% |
6,960,065 |
2.7% |
|
|
| Economic Characteristics |
| EMPLOYMENT STATUS |
| Population 16 years and over |
49,993 |
100.0% |
49,485 |
100.0% |
217,168,077 |
100.0% |
| Employed |
31,159 |
62.3% |
30,784 |
62.2% |
129,721,512 |
59.7% |
| Unemployed |
1,659 |
3.3% |
1,654 |
3.3% |
7,947,286 |
3.7% |
| Armed Forces |
11 |
0.0% |
11 |
0.0% |
1,152,137 |
0.5% |
|
| COMMUTING TO WORK |
| Workers 16 years and over |
30,331 |
100.0% |
29,968 |
100.0% |
128,279,228 |
100.0% |
| Car, truck, or van -- drove alone |
22,114 |
72.9% |
21,835 |
72.9% |
97,102,050 |
75.7% |
| Car, truck, or van -- carpooled |
4,920 |
16.2% |
4,865 |
16.2% |
15,634,051 |
12.2% |
| Public trans. (including taxicab) |
1,886 |
6.2% |
1,886 |
6.3% |
6,067,703 |
4.7% |
| Mean travel time to work (min.) |
34.0 |
|
34.0 |
|
26.0 |
|
|
| OCCUPATION |
| Employed civilian pop 16 yrs. and over |
31,159 |
100.0% |
30,784 |
100.0% |
129,721,512 |
100.0% |
| Mgmt,Prof,& related jobs |
11,216 |
36.0% |
10,952 |
35.6% |
43,646,731 |
33.6% |
| Service occupations |
3,478 |
11.2% |
3,507 |
11.4% |
19,276,947 |
14.9% |
| Sales and office occupations |
8,303 |
26.6% |
8,161 |
26.5% |
34,621,390 |
26.7% |
| Farming,Fish,Forestry jobs |
66 |
0.2% |
66 |
0.2% |
951,810 |
0.7% |
| Construction,Extraction,Maint job |
2,252 |
7.2% |
2,285 |
7.4% |
12,256,138 |
9.4% |
| Prod,Trans,Material moving jobs |
5,844 |
18.8% |
5,813 |
18.9% |
18,968,496 |
14.6% |
|
| INCOME IN 1999 |
| Households |
18,529 |
100.0% |
18,270 |
100.0% |
105,539,122 |
100.0% |
| Less than $10,000 |
769 |
4.2% |
752 |
4.1% |
10,067,027 |
9.5% |
| $10,000 to $14,999 |
572 |
3.1% |
570 |
3.1% |
6,657,228 |
6.3% |
| $15,000 to $24,999 |
1,062 |
5.7% |
1,035 |
5.7% |
13,536,965 |
12.8% |
| $25,000 to $34,999 |
1,178 |
6.4% |
1,171 |
6.4% |
13,519,242 |
12.8% |
| $35,000 to $49,999 |
1,904 |
10.3% |
1,834 |
10.0% |
17,446,272 |
16.5% |
| $50,000 to $74,999 |
4,219 |
22.8% |
4,125 |
22.6% |
20,540,604 |
19.5% |
| $75,000 to $99,999 |
3,536 |
19.1% |
3,567 |
19.5% |
10,799,245 |
10.2% |
| $100,000 to $149,999 |
3,527 |
19.0% |
3,501 |
19.2% |
8,147,826 |
7.7% |
| $150,000 to $199,999 |
1,201 |
6.5% |
1,155 |
6.3% |
2,322,038 |
2.2% |
| $200,000 or more |
561 |
3.0% |
560 |
3.1% |
2,502,675 |
2.4% |
| Median household income |
$71,863 |
|
$72,243 |
|
$41,994 |
|
| Families |
15,688 |
100.0% |
15,529 |
100.0% |
72,261,780 |
100.0% |
| Less than $10,000 |
389 |
2.5% |
380 |
2.4% |
4,155,386 |
5.8% |
| $10,000 to $14,999 |
301 |
1.9% |
301 |
1.9% |
3,115,586 |
4.3% |
| $15,000 to $24,999 |
812 |
5.2% |
813 |
5.2% |
7,757,397 |
10.7% |
| $25,000 to $34,999 |
1,021 |
6.5% |
1,014 |
6.5% |
8,684,429 |
12.0% |
| $35,000 to $49,999 |
1,705 |
10.9% |
1,647 |
10.6% |
12,377,108 |
17.1% |
| $50,000 to $74,999 |
3,646 |
23.2% |
3,578 |
23.0% |
16,130,100 |
22.3% |
| $75,000 to $99,999 |
3,173 |
20.2% |
3,207 |
20.7% |
9,009,327 |
12.5% |
| $100,000 to $149,999 |
3,160 |
20.1% |
3,131 |
20.2% |
6,936,210 |
9.6% |
| $150,000 to $199,999 |
1,000 |
6.4% |
978 |
6.3% |
1,983,673 |
2.7% |
| $200,000 or more |
481 |
3.1% |
480 |
3.1% |
2,112,564 |
2.9% |
| Median family income |
$74,675 |
|
$75,182 |
|
$50,046 |
|
| Per capita income |
$22,878 |
|
$22,855 |
|
$21,587 |
|
|
|
| Housing Characteristics |
| HOME VALUE |
| Specified owner-occupied units |
11,430 |
100.0% |
11,401 |
100.0% |
55,212,108 |
100.0% |
| Less than $50,000 |
329 |
2.9% |
323 |
2.8% |
5,457,817 |
9.9% |
| $50,000 to $99,999 |
103 |
0.9% |
99 |
0.9% |
16,778,971 |
30.4% |
| $100,000 to $149,999 |
372 |
3.3% |
372 |
3.3% |
13,110,384 |
23.7% |
| $150,000 to $199,999 |
960 |
8.4% |
948 |
8.3% |
8,075,904 |
14.6% |
| $200,000 to $299,999 |
3,427 |
30.0% |
3,492 |
30.6% |
6,583,049 |
11.9% |
| $300,000 to $499,999 |
5,181 |
45.3% |
5,154 |
45.2% |
3,584,108 |
6.5% |
| $500,000 to $999,999 |
1,041 |
9.1% |
996 |
8.7% |
1,308,116 |
2.4% |
| $1,000,000 or more |
17 |
0.1% |
17 |
0.1% |
313,759 |
0.6% |
| Median |
$314,600 |
|
$313,100 |
|
$119,600 |
|
|
| GROSS RENT |
| Specified renter-occupied units |
5,297 |
100.0% |
5,099 |
100.0% |
35,199,502 |
100.0% |
| Median |
$1,091
|
|
$1,089 |
|
$602 |
|
|
Totals may not add to 100 due to rounding. Source: U.S. Census 2000
|
|
|
|